What this project was
BlockHorizon came to us as a pre-launch startup with no name, no brand, and no product. They had a clear idea: build an institutional-grade Bitcoin analytics platform that makes professional blockchain data accessible to a wider audience, competing with established players like Glassnode.
We were responsible for everything. Company naming, visual identity, marketing website, and a full-stack analytics application that renders 200+ custom charts from real-time blockchain data.
Starting from zero
Most projects begin with at least a company name and some brand direction. BlockHorizon had neither. Every design decision, from colors to typography, had to be made without any existing brand to anchor against. That's freeing in theory and slow in practice.
We ran competitor analysis and user persona workshops before opening any design tools. That upfront work added three weeks to the timeline but prevented the kind of expensive redesigns that happen when you skip discovery on a brand-new company.
A useful number for anyone in a similar position: starting from absolute zero adds 30-40% more discovery time compared to a project with existing brand assets.
Full-stack complexity we underestimated
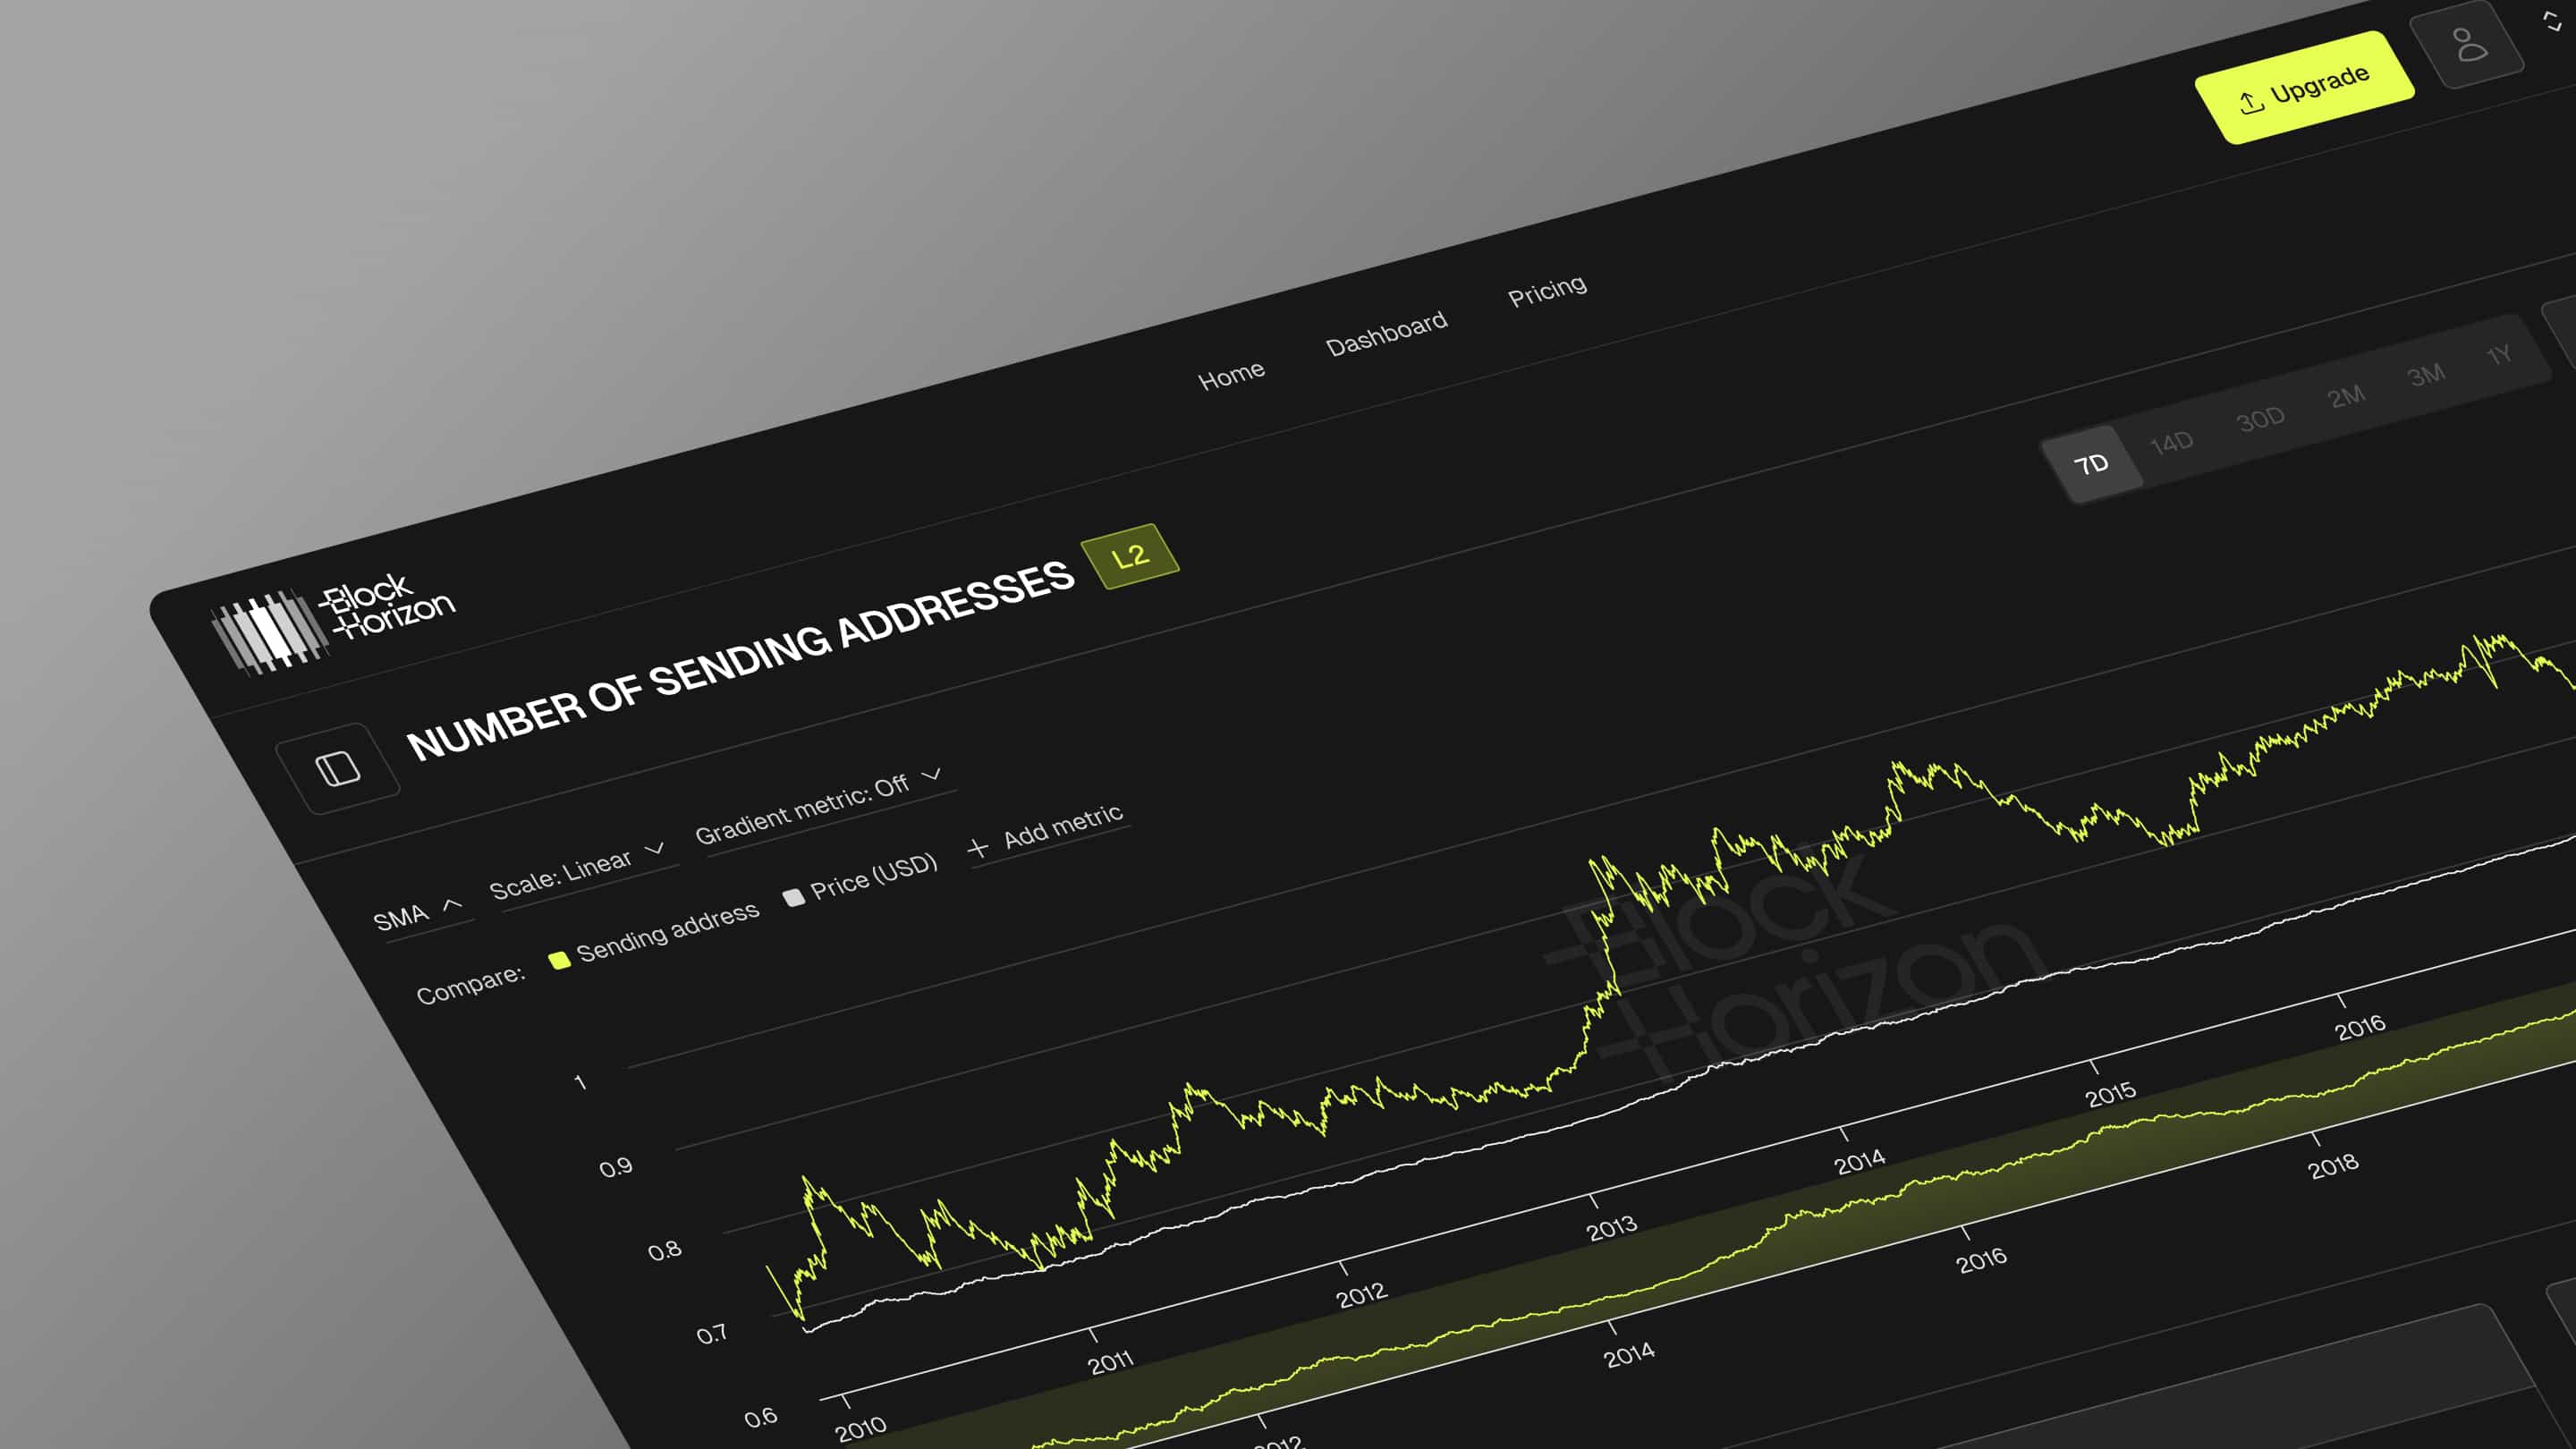
LoudFace does a lot of Webflow work. This project needed full-stack development at a scale we hadn't done before. The application had to process real-time blockchain data, render 200+ chart configurations, handle authentication and subscriptions, and meet institutional security standards.
Our initial scope estimated 6 weeks of development. It took 4 months. Chart library integration with Highcharts was harder than expected. Data encryption for API security added time. Making 200+ chart types work on mobile required rethinking layouts that looked fine on desktop. And backend optimization for real-time data streaming was its own project within the project.
If you're scoping a data visualization platform: add 50-75% timeline buffer. We wish someone had told us that.
Bridging the vision gap
BlockHorizon's founders had a strong vision but limited technical background. That created friction when features took longer than they expected or needed architectural changes that weren't obvious from the outside.
Some specific examples: what they thought would be a simple GitBook embed actually required custom API integration with daily data sync. "A few chart types" became 200+ unique configurations as the product took shape. And mobile optimization for complex data visualizations is a different animal from making a marketing page responsive.
What helped: weekly technical deep-dives where our developers explained trade-offs in business terms instead of jargon. That reduced scope creep and made decisions faster.
What we built
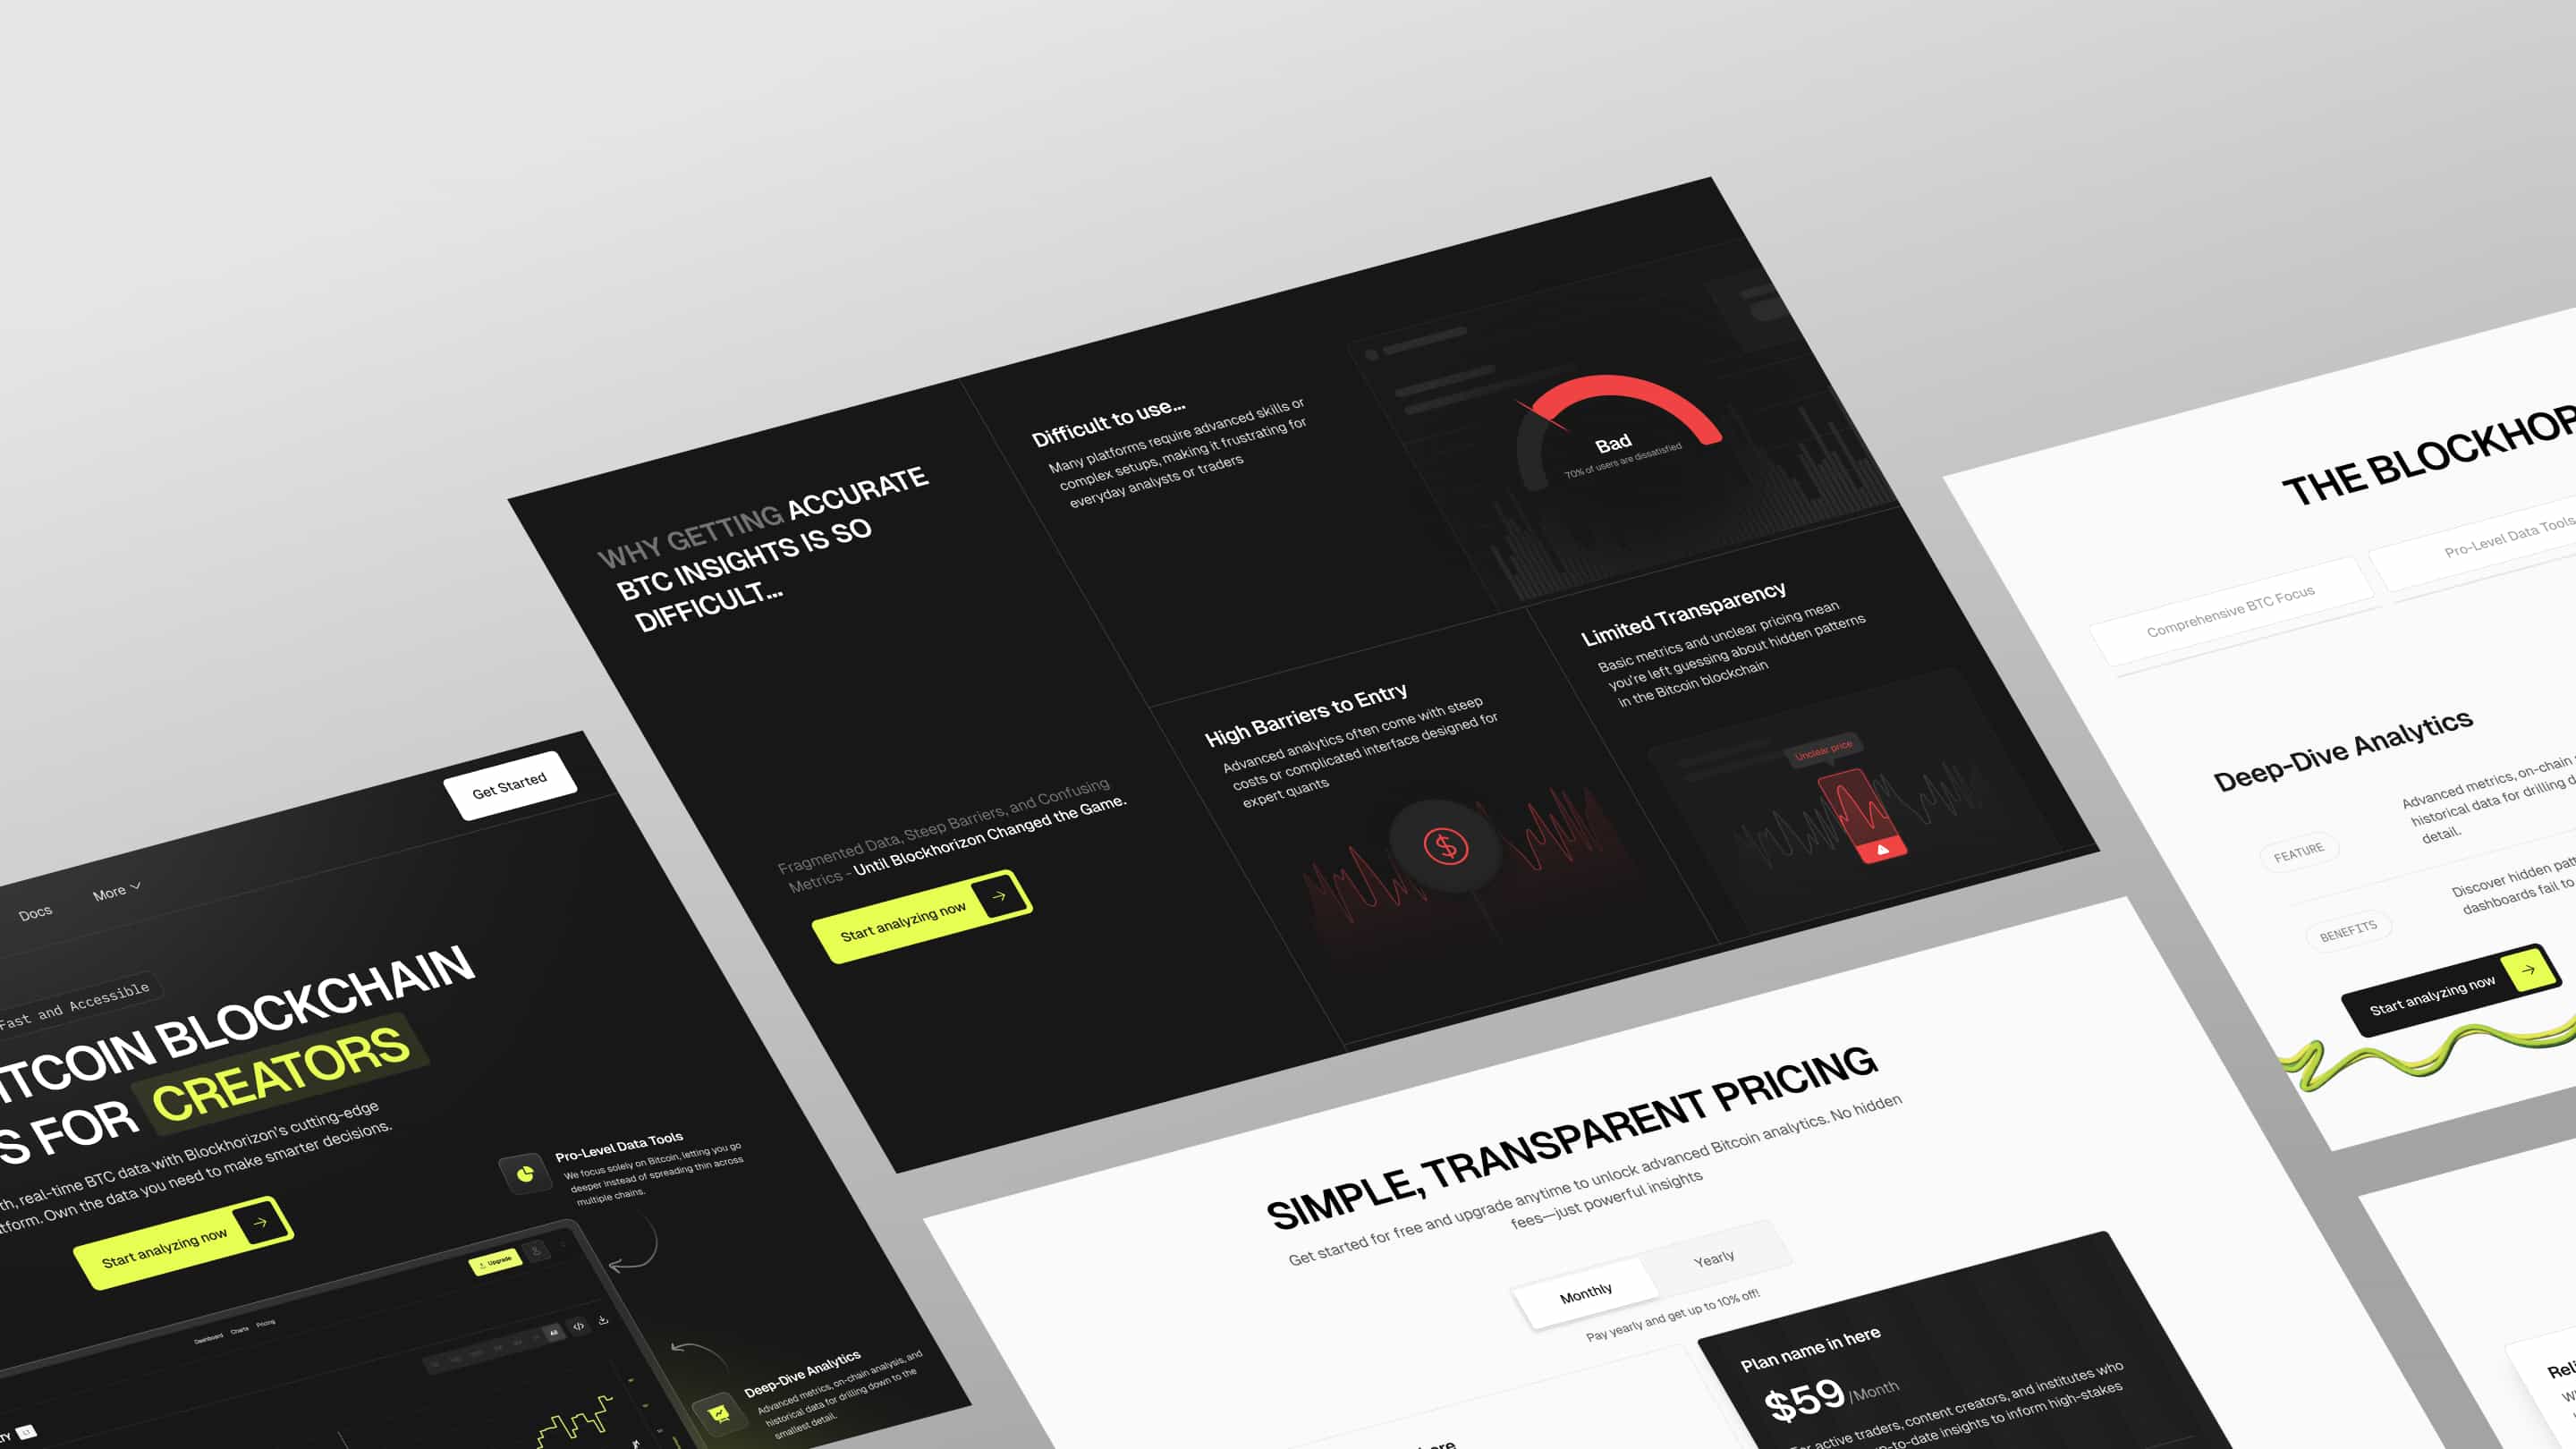
Brand identity
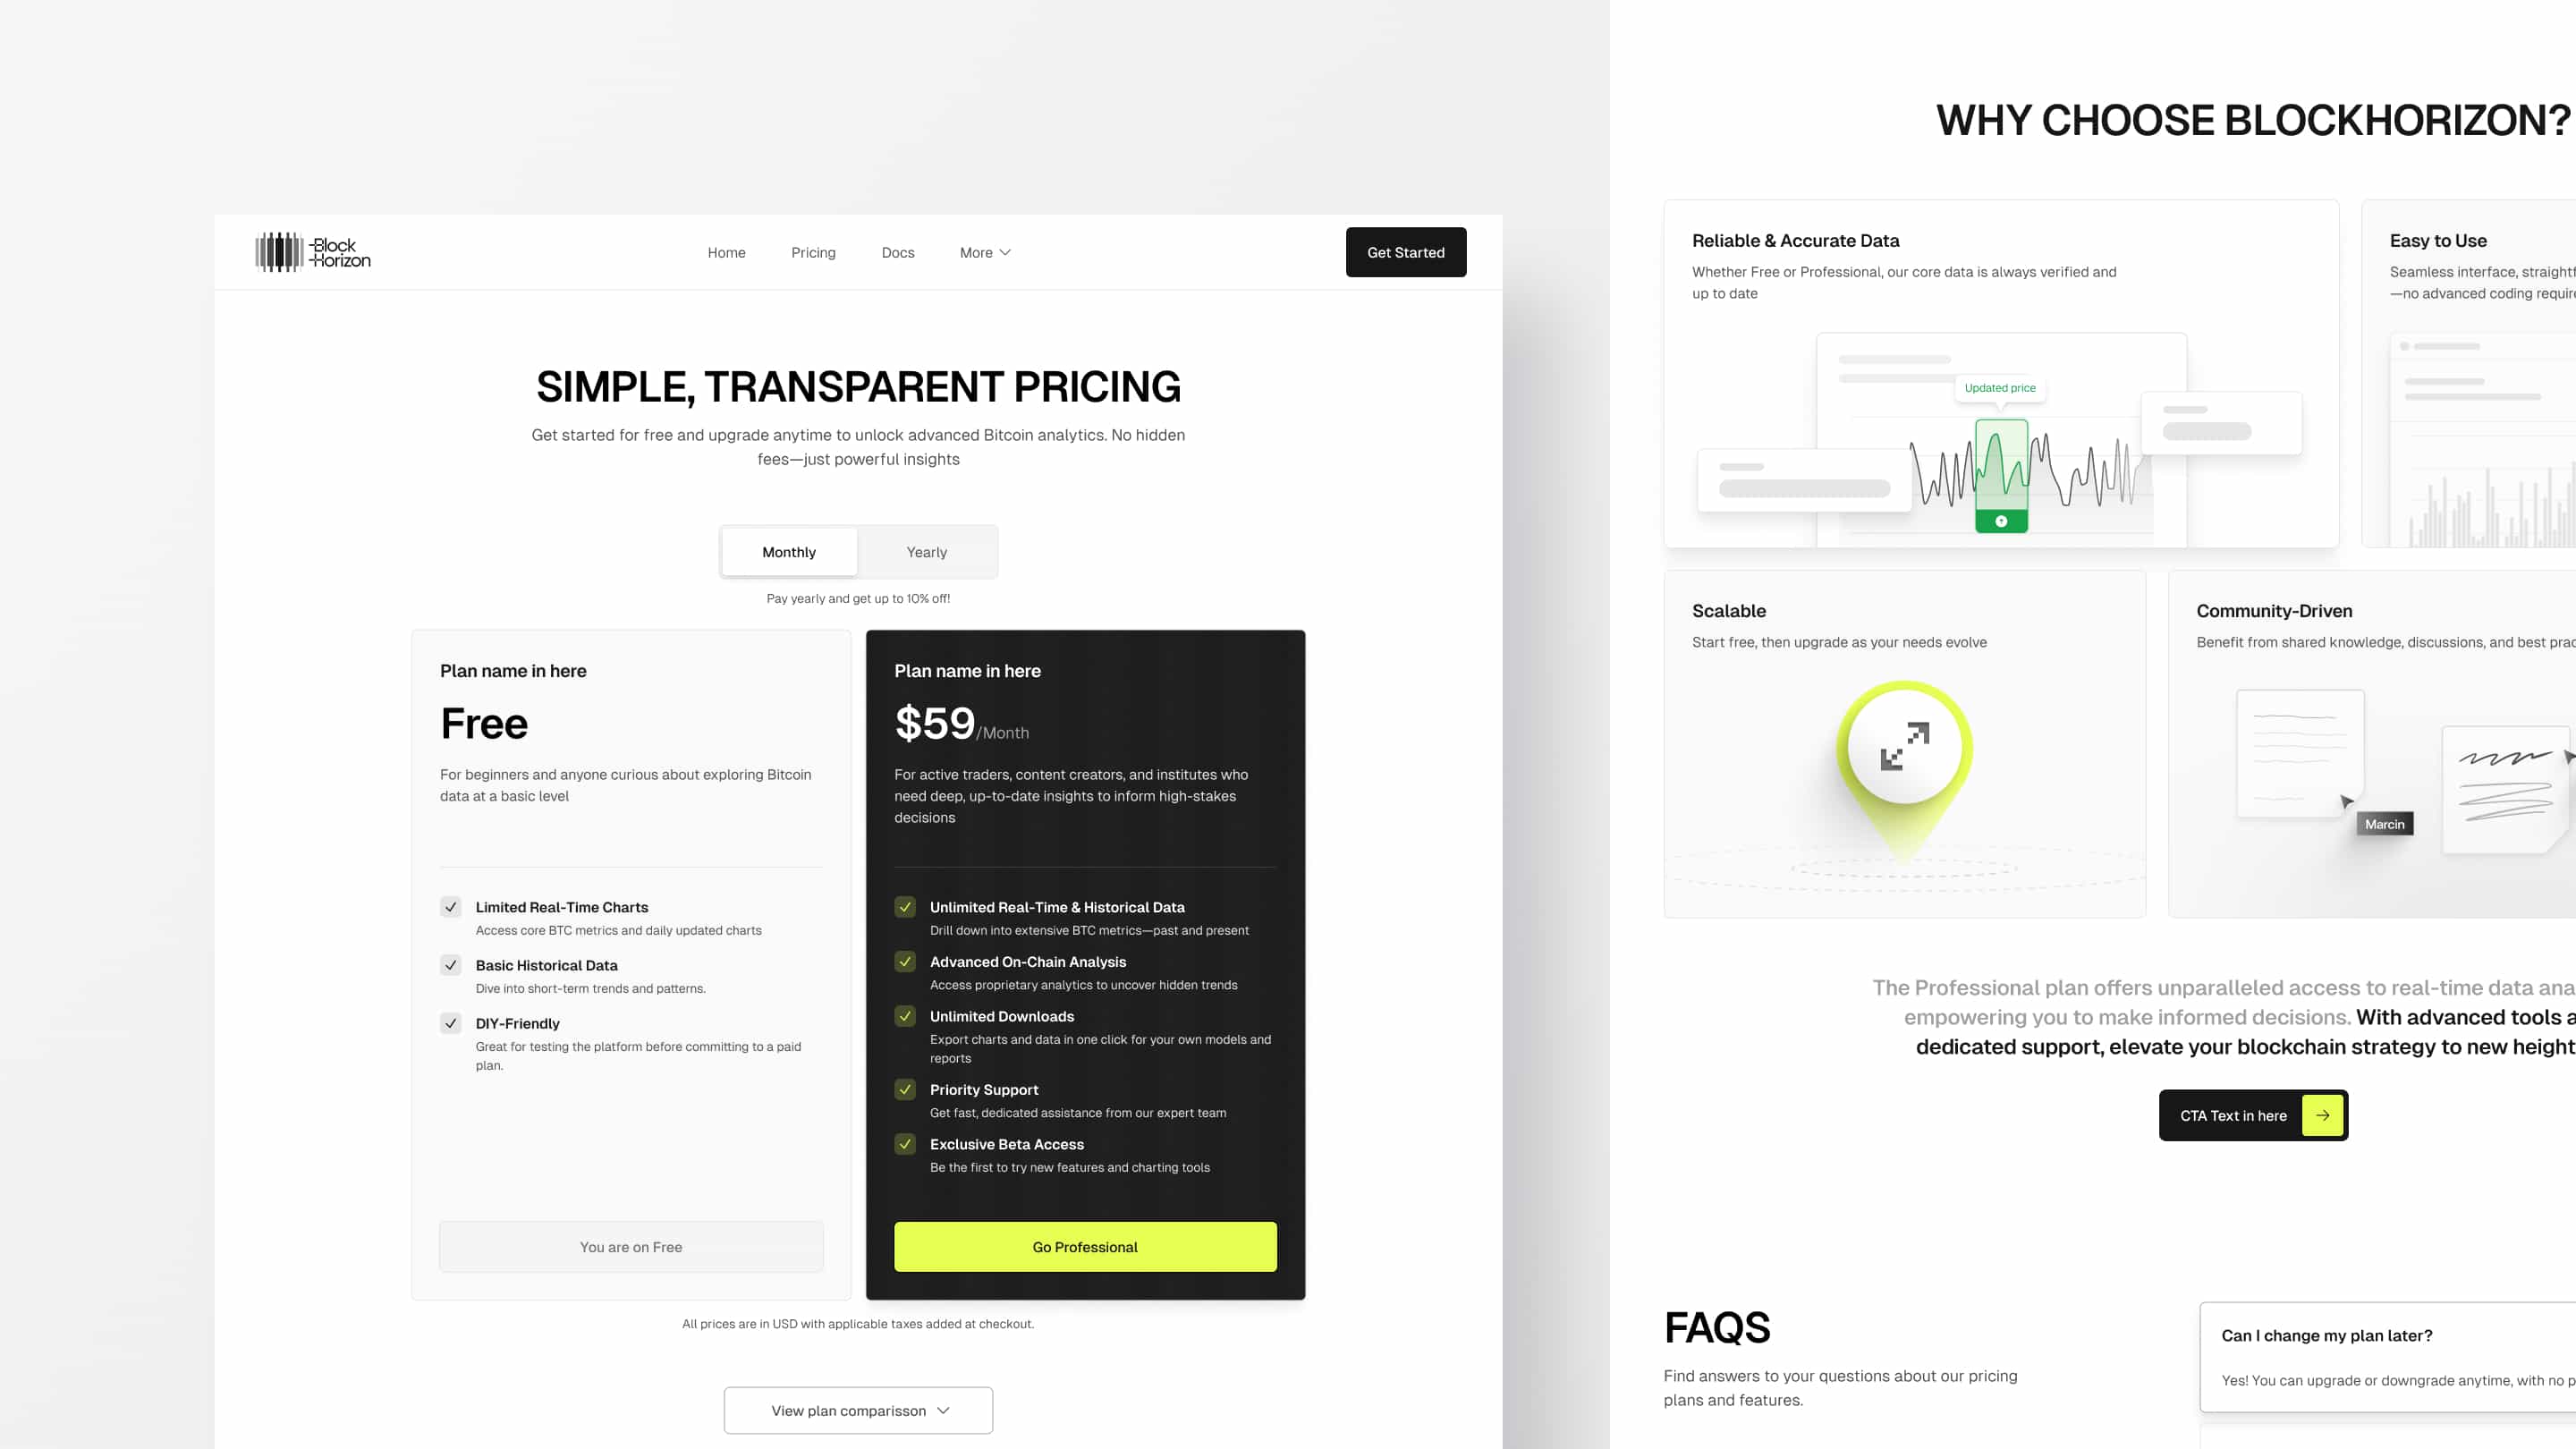
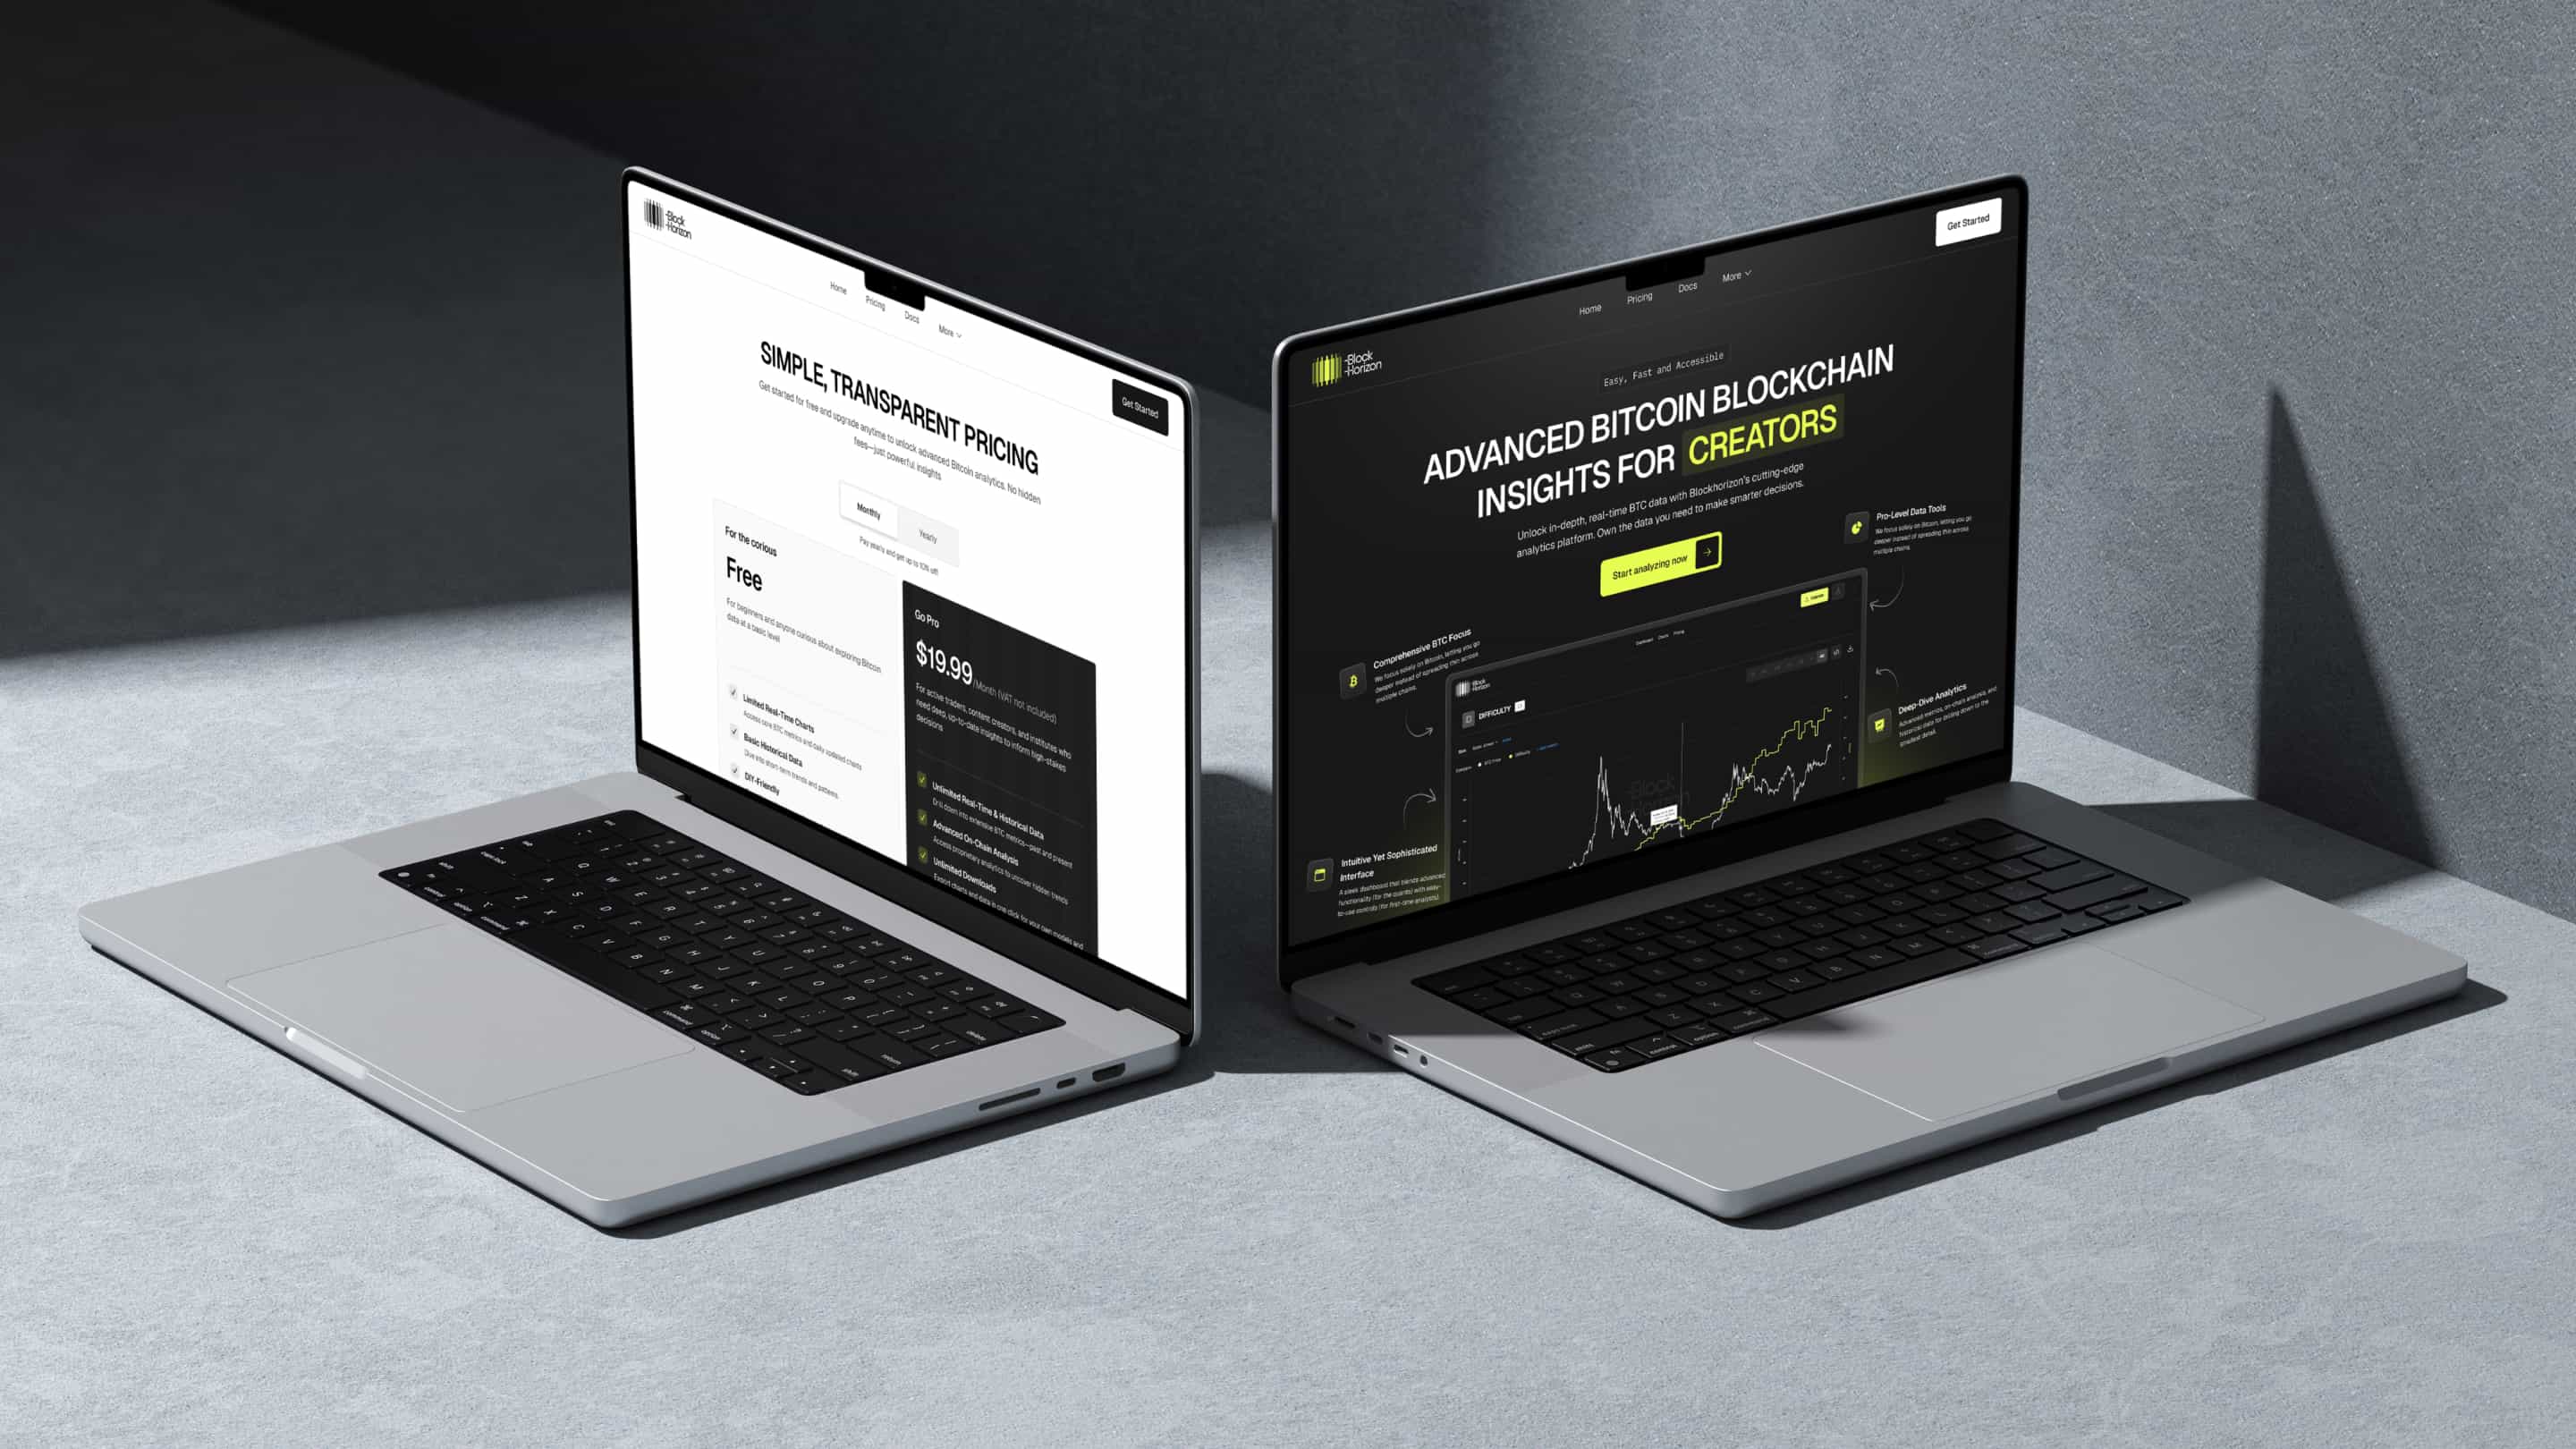
The Bitcoin analytics space is full of sterile, corporate-looking platforms. We went for something that looks premium without being intimidating, since BlockHorizon wanted retail investors to feel welcome alongside institutional users. Post-launch, user feedback consistently pointed to the "clean, modern interface" as a reason they chose BlockHorizon over alternatives.
Architecture
We split the marketing site (Webflow) from the application (React + Cloudflare). The marketing site loads fast, is SEO-friendly, and easy for the team to update. The application handles the heavy lifting: data processing, real-time chart updates, secure user management. This dual setup cut hosting costs by 60% compared to running everything on enterprise application servers.
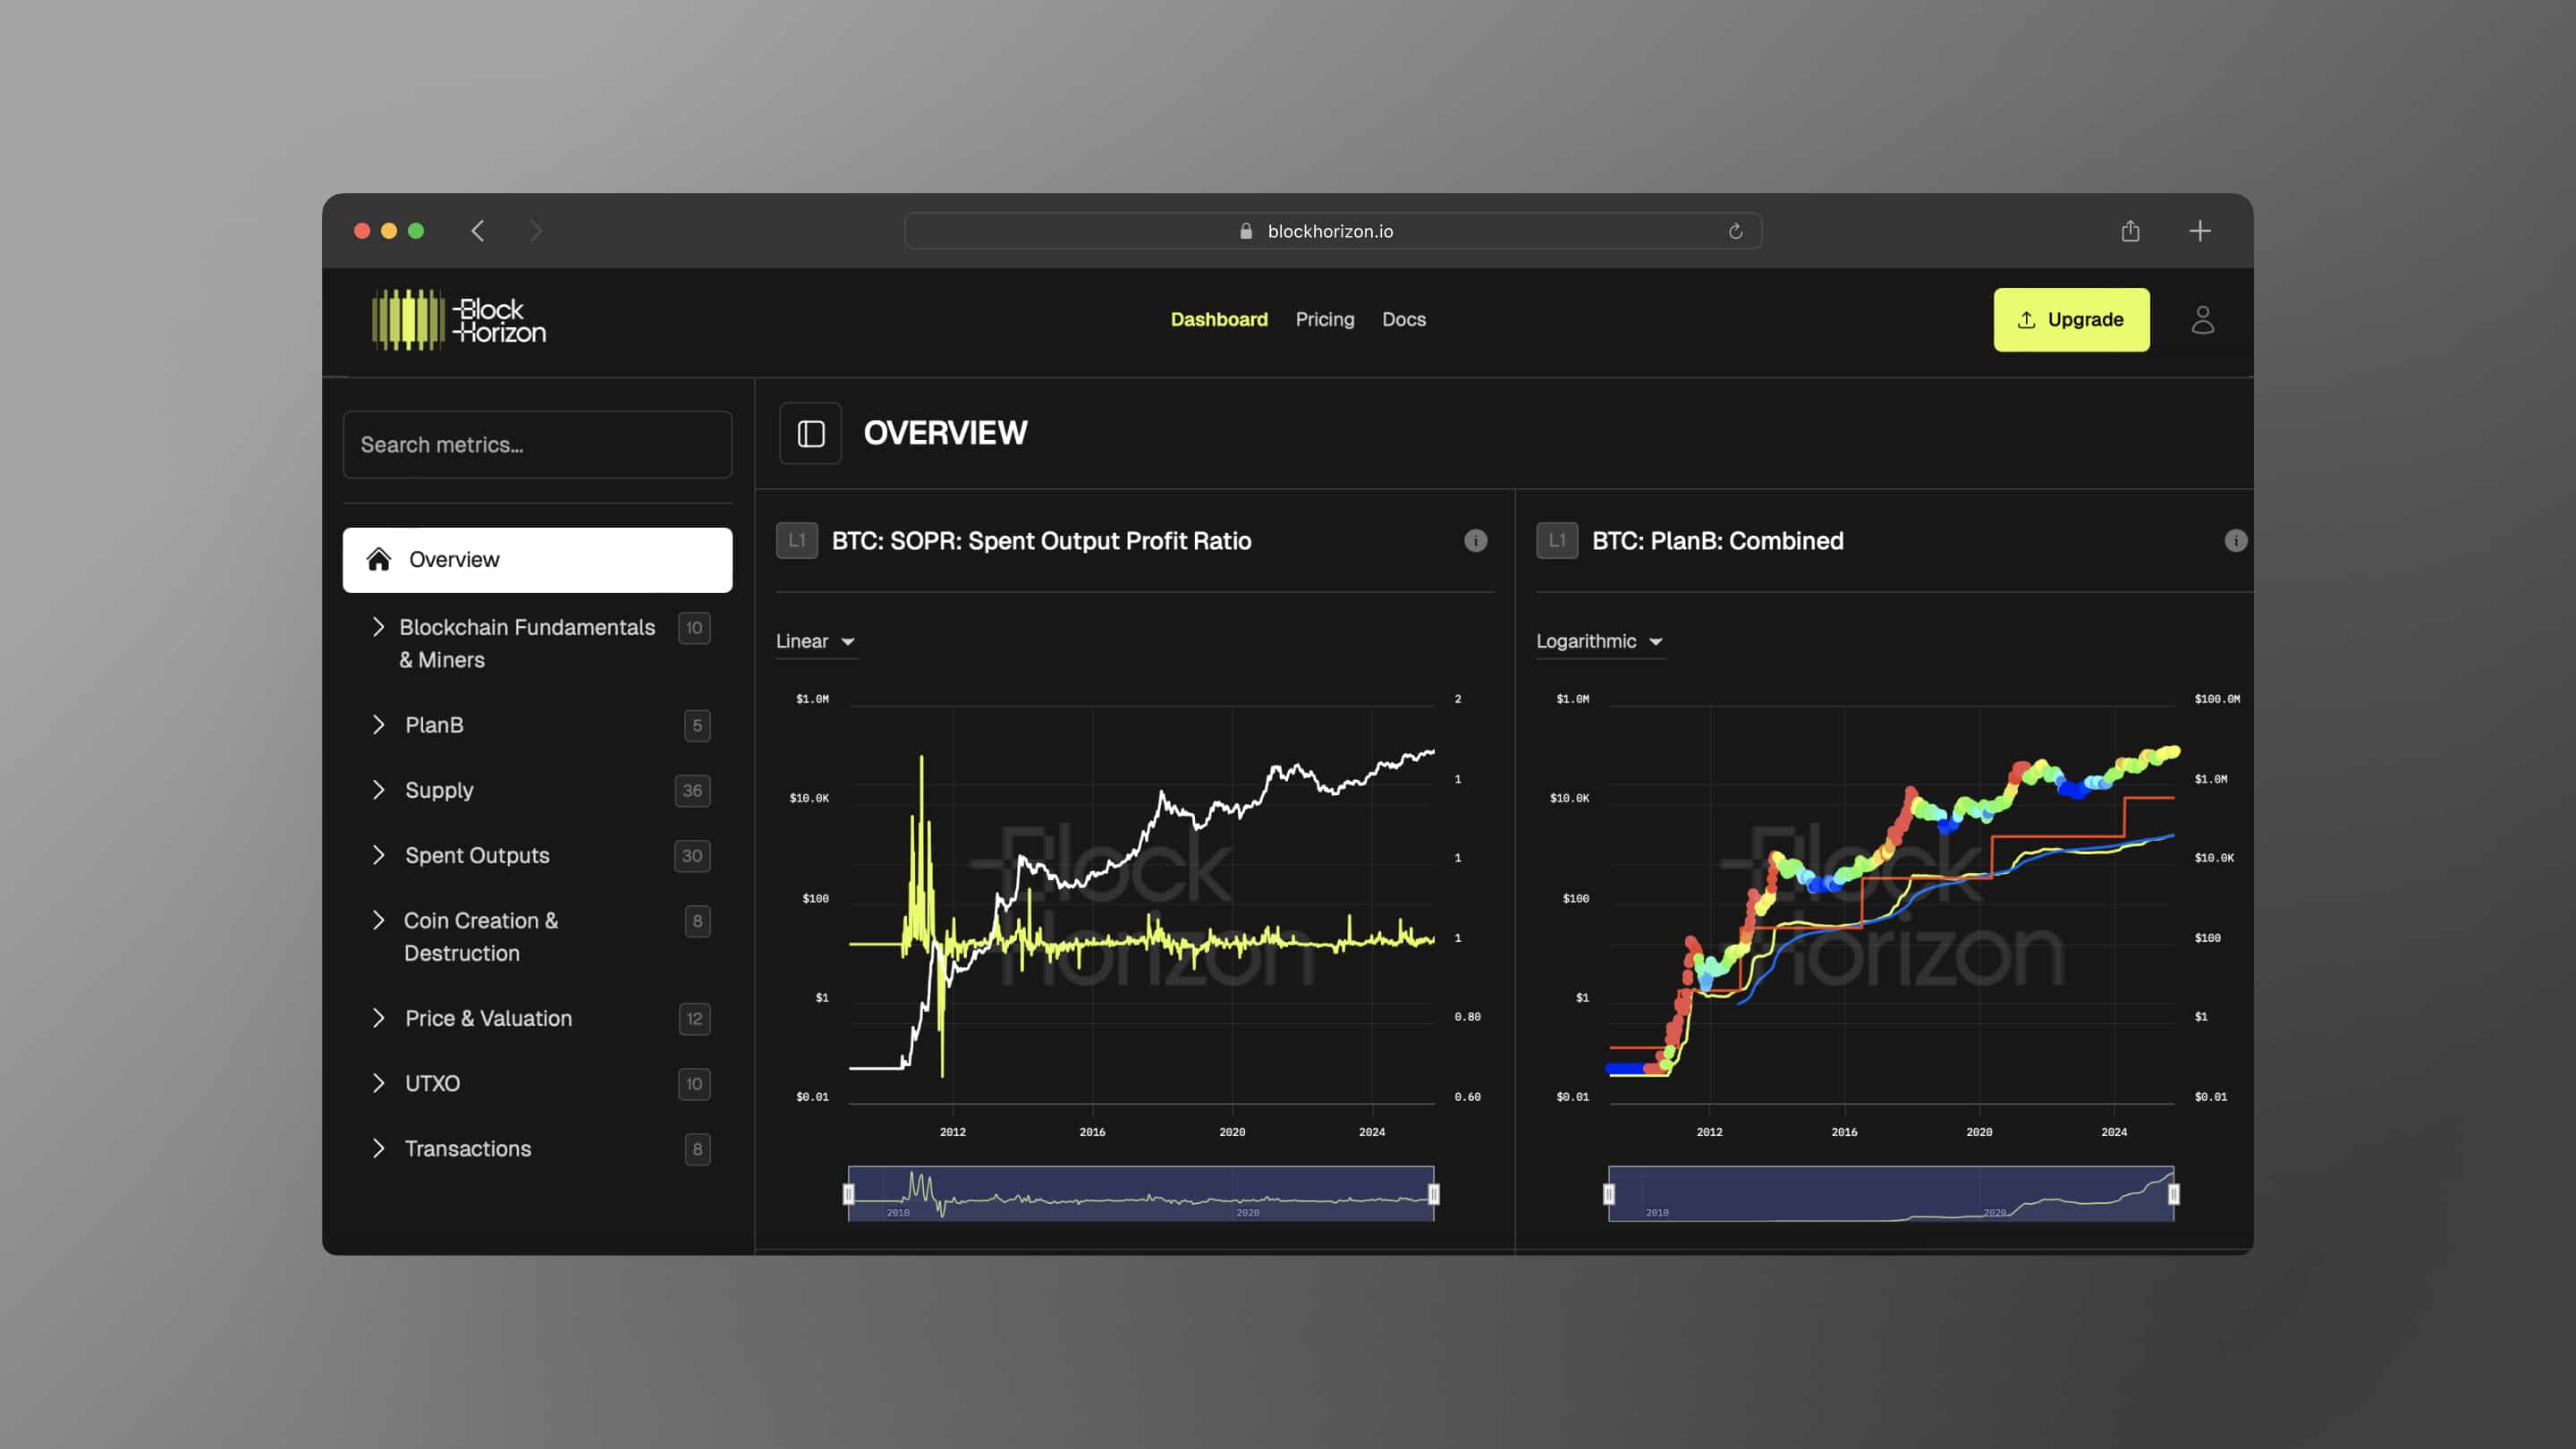
User experience
The platform uses a collapsible sidebar adapted from desktop trading platforms. Charts load essential data first, with advanced metrics available on demand. Every metric has a GitBook-powered explanation attached, which cut down support requests from users who didn't know what they were looking at.
Beta users were active within one day of launch, and the platform handled real-time blockchain data without performance issues from the start.
What shipped
Complete brand identity and guidelines. A responsive marketing website with subscription management. A full-stack analytics application with 200+ custom charts, user authentication, payment processing, and mobile optimization across all breakpoints. Plus documentation and handoff materials for the client's team.
The client secured an additional funding round partly on the strength of the platform demo. The product is live at blockhorizon.io.
Lessons from this project
Data visualization platforms have a completely different budget profile from standard web projects. Standard web work is roughly 70% design and development, 30% testing. A data platform is closer to 50% development, 30% data integration, 20% performance optimization.
Communication rhythm matters more on complex technical projects. We moved from weekly check-ins to daily updates during development phases, and that dramatically improved client satisfaction even during delays.
And scope definition has to be ruthless. The distance between "Bitcoin analytics platform" and "Bitcoin analytics platform with 200+ charts, real-time data, mobile optimization, and educational content" is months of development time. If you're planning something like this, expect multiple scope definition sessions before anyone writes a line of code.